
- Empty cart.
- Continue Shopping
How to Build a Raspberry Pi Weather & Air Quality Monitor with Python
- Posted on
 Deepak Joshi
- 0
- Categories: Raspberry Pi Projects

Introduction
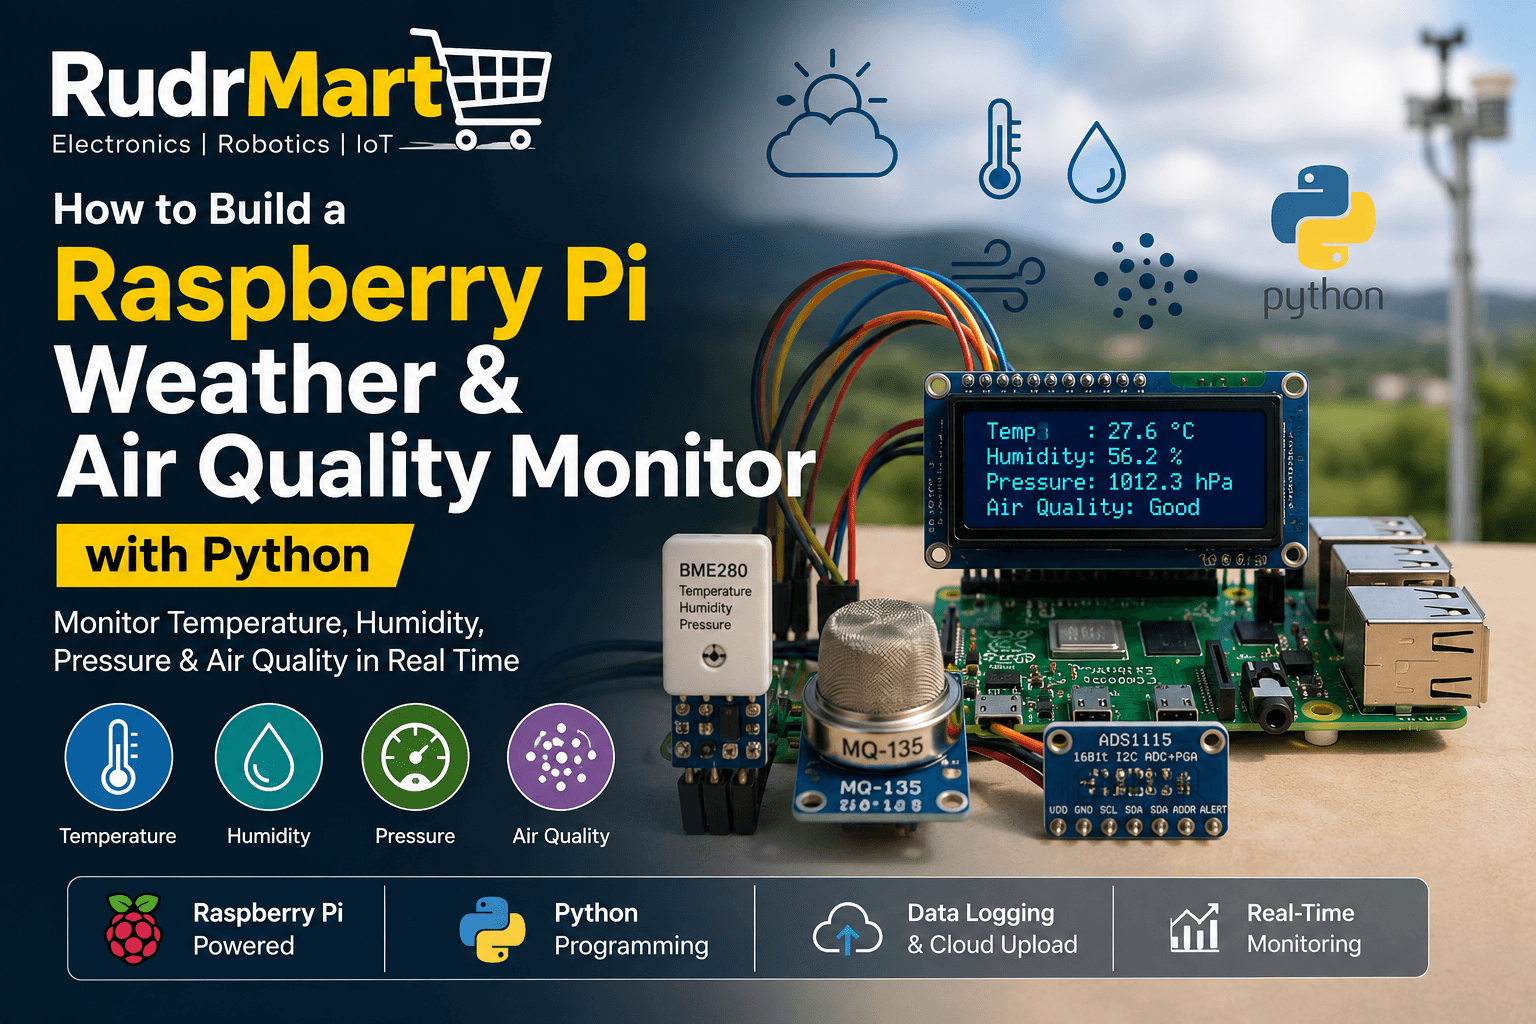
Monitoring weather conditions and indoor air quality has become increasingly important for homes, offices, schools, and research projects. Fortunately, with a Raspberry Pi Weather & Air Quality Monitor, you can collect real-time environmental data using affordable sensors and Python programming.
Whether you’re a beginner learning Raspberry Pi or an experienced maker looking for an IoT project, this guide will help you build a reliable weather station capable of measuring temperature, humidity, atmospheric pressure, and air quality. By the end of this tutorial, you’ll have a fully functional monitoring system that can display live readings, store historical data, and even upload information to cloud dashboards.
Why Build a Raspberry Pi Weather & Air Quality Monitor?
A Raspberry Pi-based weather station offers far more flexibility than ready-made devices. You can customize sensors, automate data logging, and integrate cloud platforms for remote monitoring.
Some major benefits include:
- Real-time environmental monitoring
- Low-cost DIY project
- Learn Python programming
- Understand IoT fundamentals
- Expand with additional sensors
- Store long-term weather data
- Access data remotely
- Build automation projects based on sensor readings
This project is suitable for students, hobbyists, engineers, and anyone interested in environmental monitoring.
Components Required
Before starting, gather the following components.
| Component | Purpose |
|---|---|
| Raspberry Pi 4 or Raspberry Pi 5 | Main controller |
| MicroSD Card | Operating system |
| Power Supply | Powers Raspberry Pi |
| BME280 Sensor | Temperature, Humidity & Pressure |
| MQ-135 Air Quality Sensor | Air quality monitoring |
| ADS1115 ADC Module | Reads analog MQ-135 output |
| Breadboard | Circuit connections |
| Jumper Wires | Wiring |
| Wi-Fi Connection | Cloud connectivity |
| Python 3 | Programming language |
Understanding the Sensors
BME280 Sensor
The BME280 measures:
- Temperature
- Relative Humidity
- Atmospheric Pressure
It communicates through I2C, making it easy to connect to Raspberry Pi.
Advantages
- High accuracy
- Low power consumption
- Easy Python libraries
- Compact design
MQ-135 Air Quality Sensor
The MQ-135 detects various harmful gases such as:
- Carbon dioxide (approximate)
- Ammonia
- Benzene
- Smoke
- Alcohol
- Air pollutants
Since Raspberry Pi lacks analog inputs, you’ll need an ADS1115 Analog-to-Digital Converter to read MQ-135 values.
System Architecture
The project follows this simple workflow.
Sensors
↓
Raspberry Pi
↓
Python Program
↓
Data Processing
↓
Display / Database / Cloud Dashboard
Python continuously collects sensor readings, processes the data, and stores or displays it.
Step 1: Install Raspberry Pi OS
Download the latest Raspberry Pi OS using Raspberry Pi Imager.
After installation:
- Connect to Wi-Fi
- Enable SSH (optional)
- Enable I2C interface
- Update the operating system
Run:
</> Bash
sudo apt update
sudo apt upgrade
Keeping your Raspberry Pi updated ensures compatibility with the latest Python libraries.
Step 2: Enable I2C
Open configuration:
</> Bash
sudo raspi-config
Navigate to:
Interface Options
    →
I2C
    →
Enable
Reboot your Raspberry Pi.
Step 3: Install Required Python Libraries
Install Python packages:
</> Bash
pip install adafruit-circuitpython-bme280
pip install adafruit-blinka
pip install board
pip install busio
pip install adafruit-circuitpython-ads1x15
These libraries simplify communication with sensors.
Step 4: Connect the Sensors
BME280 Connections
| BME280 | Raspberry Pi |
|---|---|
| VIN | 3.3V |
| GND | GND |
| SDA | SDA |
| SCL | SCL |
MQ-135 with ADS1115
| ADS1115 | Raspberry Pi |
|---|---|
| VCC | 3.3V |
| GND | GND |
| SDA | SDA |
| SCL | SCL |
Connect the analog output of the MQ-135 to one of the ADS1115 input channels.
Step 5: Write the Python Program
Your Python application should:
- Read temperature
- Read humidity
- Read pressure
- Read air quality values
- Display results
- Save readings to CSV
- Upload data to cloud services (optional)
A basic workflow includes:
- Initialize sensors
- Read sensor values
- Convert raw data
- Display results
- Store readings
- Repeat every few seconds
Step 6: Display the Data
You can display readings in several ways:
- Terminal output
- LCD Display
- OLED Display
- Web Dashboard
- Flask Web Server
- Grafana Dashboard
- ThingsBoard
- ThingSpeak
A web dashboard allows remote monitoring from any device.
Step 7: Store Historical Data
Saving sensor readings enables long-term analysis.
Popular storage options include:
- CSV files
- SQLite database
- MySQL
- PostgreSQL
- InfluxDB
Historical data helps identify weather trends and indoor air quality patterns.
Step 8: Visualize Data
Visualization makes environmental data easier to understand.
Python libraries like Matplotlib and Plotly can generate:
- Temperature graphs
- Humidity charts
- Pressure trends
- Air quality history
- Daily averages
- Weekly reports
Graphs provide valuable insights into changing environmental conditions.
Step 9: Send Alerts
Enhance your project by sending alerts when readings exceed safe limits.
Examples include:
- High temperature alerts
- Poor air quality warnings
- High humidity notifications
- Low pressure alerts
Notifications can be sent via:
- Telegram Bot
- SMS
- Push Notifications
Applications of a Raspberry Pi Weather & Air Quality Monitor
This project has many practical applications.
Home Monitoring
Track indoor comfort levels and improve ventilation.
Smart Greenhouses
Monitor environmental conditions for healthy plant growth.
Schools and Colleges
Use the project for IoT, Python, and embedded systems learning.
Offices
Improve workplace air quality.
Research Projects
Collect environmental data for analysis.
Industrial Monitoring
Observe environmental conditions in warehouses and manufacturing facilities.
Project Enhancements
After completing the basic project, consider adding:
- Rain sensor
- UV sensor
- Wind speed sensor
- Wind direction sensor
- GPS module
- Solar power
- Camera module
- AI-based weather prediction
- MQTT integration
- Home Assistant compatibility
These upgrades transform a simple weather station into a powerful IoT monitoring system.
Common Troubleshooting Tips
If you encounter issues, try the following:
- Verify all wiring connections.
- Check that I2C is enabled.
- Confirm sensor addresses using an I2C scanner.
- Install the latest Python libraries.
- Ensure adequate power to the Raspberry Pi.
- Test each sensor independently before combining them.
Most problems result from incorrect wiring or missing software dependencies.
Best Practices
To ensure accurate readings:
- Place sensors away from direct sunlight.
- Avoid mounting near heat sources.
- Protect sensors from rain if installed outdoors.
- Calibrate the MQ-135 sensor before use.
- Keep software updated regularly.
- Back up logged data periodically.
These practices improve reliability and measurement accuracy.
Conclusion
Building a Raspberry Pi Weather & Air Quality Monitor with Python is an excellent way to learn electronics, programming, and IoT development. This project combines affordable hardware with powerful software, enabling you to monitor temperature, humidity, pressure, and air quality in real time.
Moreover, the project is highly customizable. As your skills improve, you can integrate cloud services, automation platforms, AI models, and smart home systems to create a professional-grade environmental monitoring solution. Whether you’re building it for learning, research, or practical use, this project offers endless opportunities to explore the world of Raspberry Pi and Python.
Frequently Asked Questions (FAQs)
1. Can beginners build a Raspberry Pi Weather & Air Quality Monitor?
Yes. With basic Python knowledge and simple wiring skills, beginners can complete this project.
2. Which Raspberry Pi model is recommended?
A Raspberry Pi 4 or Raspberry Pi 5 is recommended, although Raspberry Pi 3 can also handle this project.
3. Why is an ADS1115 required?
The MQ-135 outputs analog signals, while Raspberry Pi only supports digital inputs. The ADS1115 converts analog values into digital data.
4. Can I upload the data to the cloud?
Yes. You can integrate platforms such as ThingSpeak, MQTT brokers, Grafana, Home Assistant, or custom web servers.
5. Can this project be expanded?
Absolutely. You can add rain, wind, UV, GPS, camera, solar power, and AI-based weather prediction modules.
Air Quality MonitorBME280 SensorElectronics ProjectsEmbedded SystemsIoT ProjectsMQ-135 SensorPython ProgrammingRaspberry PiRaspberry Pi for Beginnersraspberry pi weather monitorRaspberry ProjectRudr Mart
